Three Ways to Analyze Likert Scales - Avoiding the Likert Crush
June 27, 2020, 7:57 a.m.

Have you ever been a victim of the Likert Crush? Many of us have. This is when you develop a great survey tool, administer the questionnaire, collect the data, analyze the data, and send it away for peer review... only to get a fast response critiquing your analysis of the Likert data. Often reviewers will question your analysis and recommend "non-parametric methods" or some other analysis.
Likert questions are common in survey research. They are extremely easy to write for the researcher. And, the familiar "agree" versus "disagree" response format is easy for respondents. Unfortunately, the analysis of Likert data is extremely controversial. There is very little consensus in the literature on how to analyze this data. Falling victim to the Likert Crush is common and very frustrating for the researchers. Reviewers will often question your analysis and it can be very difficult to provide good evidence to support your decisions.
In this article, I will present three ways that I have used as a statistician to avoid the Likert Crush.
1. Avoid Likerting
One of the best ways to avoid the problem with Likert scales is simply to avoid them. A great option is to replace Likert response questions with a linear numeric response format. This is a much simpler scale. At one end is a key phrase such as "Completely Disagree" and at the other end is "Completely Agree". Anchors are provided only at the extremes: no anchors for the middle points. Survey participants are presented with a 7 to 10 point scale of numbers between the extremes and simply indicate their response.
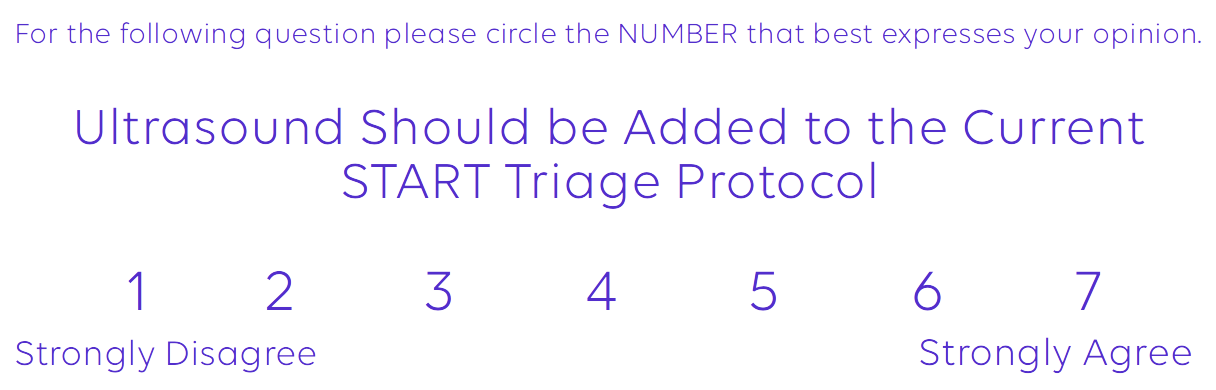
What's so great about the Linear Numeric Response Format? There is ample evidence in the literature that numerical response formats with five or more rating items can be treated as continuous data. That means being able to describe these results using the mean and standard deviation. It also allows the use of confidence intervals for the values. Even simple statistical methods such as the t-test, ANOVA, and linear regression can be used to analyze the data.
At STAT59 we encourage the use of the Linear Numeric Response Format. Unless you absolutely must use the Likert scale. We generally prefer the 7-point format, which usually ensures that a range of at least five points is used by the respondents.. We then find it very convenient to express the results in terms of mean and standard deviation and use common statistical tests for continuous data for analysis.
2. Group Them Up
Researchers, reviewers, and even statisticians often get confused between the Likert Response Format and the Likert Scale. The Likert Response Format is the common question we see when a survey asks us to rate the statement "This New Toothpaste Was Awesome" on a a scale of "completely agree", "somewhat agree", "neither agree nor disagree", "somewhat disagree", or "completely disagree."
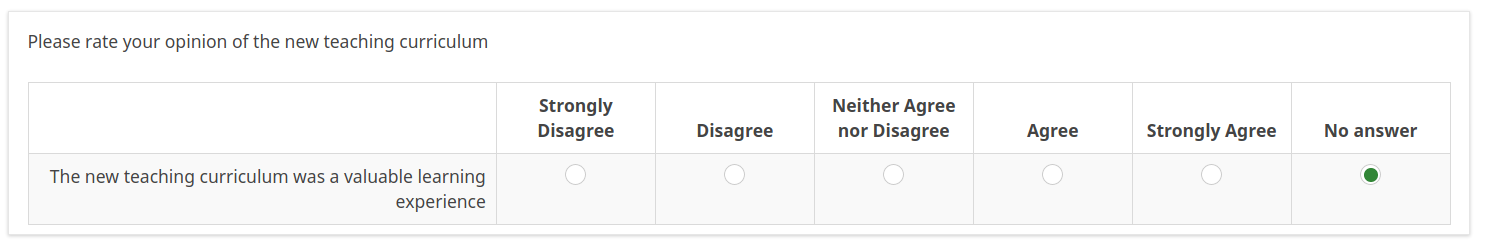
In reality, the results of a single item answered on the Likert Response Format was never meant to be analyzed in isolation. A common practice of surveyors is to ask dozens of Likert response items that are not related in a questionnaire then analyze each question individually. Unfortunately, this is not really acceptable from a statistical format. Instead, Likert Response questions are designed to be analyzed as a grouped Likert Scale.
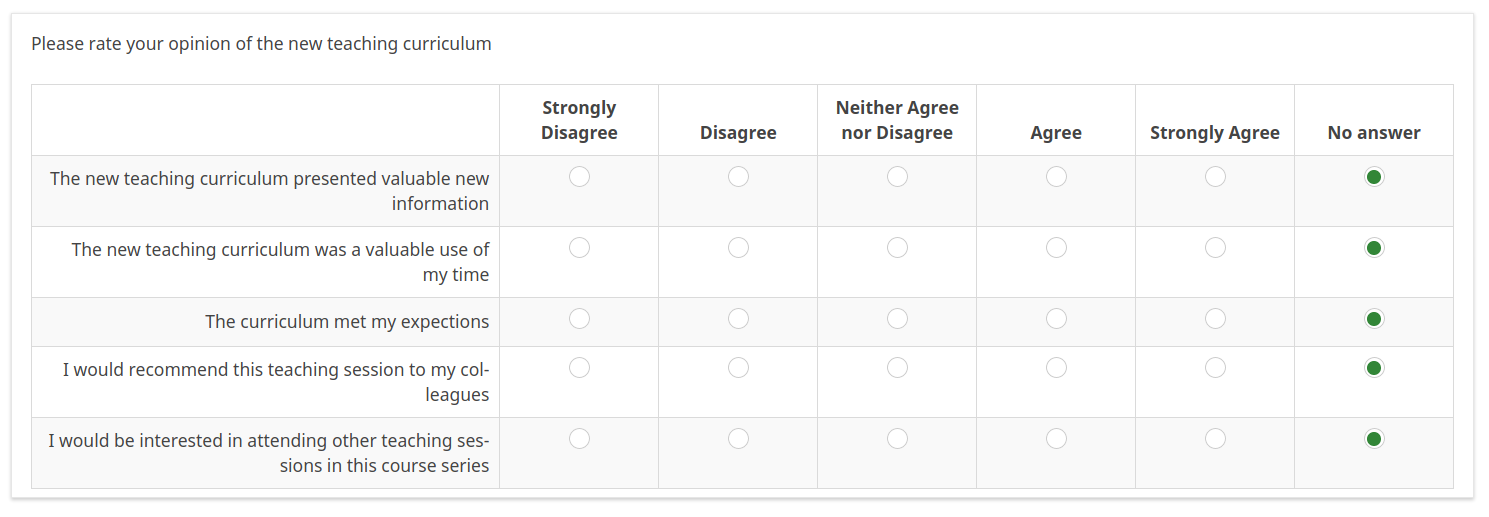
A good solution when analyzing Likert data is to design a survey containing a number of Likert questions that all point in the same direction. The group of Likert questions is then analyzed together. A Likert Scale is formed by a grouping of these Likert questions with others of a similar topic like "This New Toothpaste is Refreshing", "This New Toothpaste is Better than my Current Toothpaste," and so on.This is the original use of the Likert Scale.
Why group the questions together? There is very good evidence that aggregates of rating scales can be analyzed as continuous data. This is not too surprising. We do the same thing with multiple-choice tests. Everybody would agree that a multiple choice question with four responses A, B, C, and D is clearly categorical data. Nobody would try to do a t-test on a single multiple-choice question. However, a group of many multiple choice questions forms a test, and the score on the test with many questions can be treated as numeric data. Same thing for Likert questions. A group of questions can be analyzed as continuous data: mean, standard deviation, t-test, ANOVA, and all the fun statistics.
At STAT59 we work carefully to encourage precise grouping of Likert Response Questions into Likert Scales. Often this involves creating the questions, creating reversed questions, and then having an independent set of judges sort them into categories of positive and negative expressions. Following this, analysis can proceed as with any continuous data. This makes it easy to both describe the results and to perform any statistical tests.
3. Describe it and Leave it
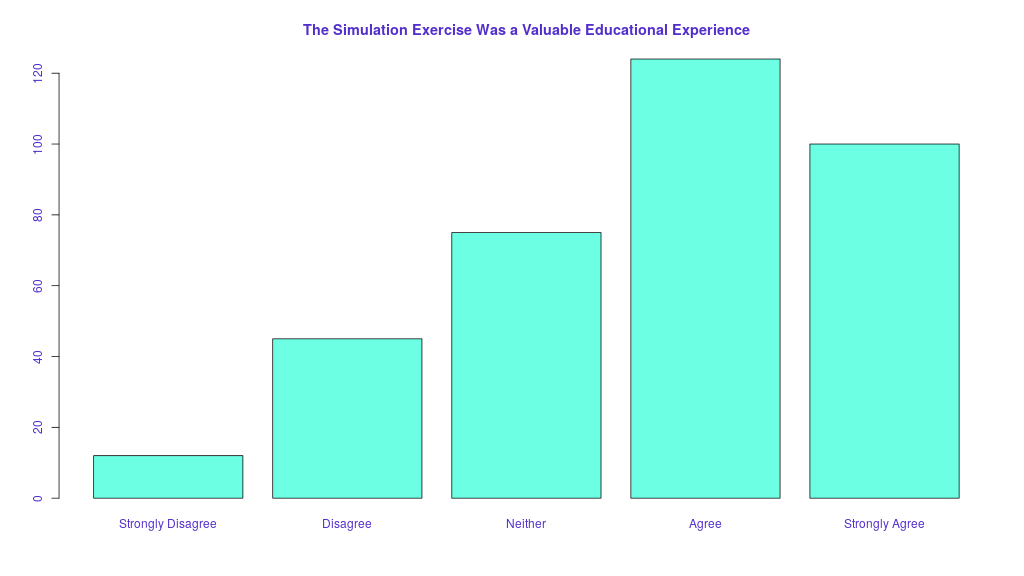
When a survey contains a multitude of Likert type questions that cannot be logically grouped, the best analysis is often simply to describe what was seen.
Describing data, particularly when coupled with good plots and graphs can be just as effective as statistical testing in getting your point across. Do you really need a p-value or confidence interval to get your point across? In a previous post, we described the current controversy in p-values, and why you should consider avoiding them when you can. In many cases, simple descriptive visualization satisfies the reviewers and prevents the Likert Crush.
In reality, performing dozens of individual statistical tests and producing dozens of p-values is almost never appropriate regardless of the type of data. Multiple statistical tests require corrections for multiplicity. (Stay tuned we will address this in further detail in an upcoming blog post). As a take-home point, if you ever have a study where you have more than a few p-values, they must be corrected for multiplicity. Get professional statistical help if you are not sure how.
At STAT59 we will often ask at the outset for any study: "What are you trying to prove?" We then match the study design to the answer. For example, if you are trying to prove that a certain chemotherapy drug works, then a rigid study design with p-values and confidence intervals is mandatory. On the other hand, if you are trying to assess student satisfaction with a teaching session, probably a description of the results will suffice. We will also ask "Who cares?" If your audience is a clinician deciding on how to treat cancer, it will require a certain level of evidence. If it is an educator thinking of trying a new teaching technique, a different level of evidence may be enough.
Avoiding the Crush
How do you avoid the crush? Any of the three methods above should prevent you from falling victim to the Likert Crush.
The most important point to remember however is that all of the above methods require very careful planning at the initial design phase of the study. If the questions are not planned carefully, it is often impossible to salvage the survey at the analysis phase. In the worst-case scenarios, this means starting again from scratch. All too often we see researchers set out blindly designing a new survey and rating scale without considering in advance how it will be analyzed. Remember, as described in our previous blog post of survey design tips: designing a survey is not easy, even for professionals. Feel free to ask us for help.
Aside from careful planning and design, careful writing of the methods can often prevent objections from the reviewers. At STAT59 we like to ensure that the final report precisely describes the a-priori analysis methods and provides strong citations to support why the analysis method was chosen. If peer reviewers do question your analysis, often providing references back to the reviewer can allow some statistics-judo and prevent you from the Likert Crush.
Does all this seem overwhelming? Do you need a more concrete example on how to stand up against the Likert Crush? Get our video example where we show how to avoid the Likert Crush by adding anchovies to ice cream.
Are You Ready to Increase Your Research Quality and Impact Factor?
Sign up for our mailing list and you will get monthly email updates and special offers.